MALDI Quality Tests: Difference between revisions
| Line 10: | Line 10: | ||
* Normalization (2-norm) | * Normalization (2-norm) | ||
* Offset correction using the high m/z region to determine the spectrum offset | * Offset correction using the high m/z region to determine the spectrum offset | ||
Spectrum noise is then determined as the standard deviation of the pre-processed spectra, with the top 20% of the intensity data, usually the peak data, removed.<br> | |||
Noise values between 20 and 80 are assigned to scores of 0 and 100, respectively (default settings). | Noise values between 20 and 80 are assigned to scores of 0 and 100, respectively (default settings). | ||
Revision as of 17:16, 29 October 2024
Introduction
In MicrobeMS, spectral quality tests can be used to evaluate bacterial MALDI-ToF mass spectra based on predefined quality criteria and exclude them from further analysis. For this purpose, MicrobeMS enables automated execution of four different quality tests (QT) on selected MALDI-ToF mass spectra, whereby a quality score is determined for each test, which then flows into the calculation of a general quality score parameter. In detail, the following quality criteria of a mass spectrum can be automatically assessed using the QT implemented in MicrobeMS: (a) mass spectral noise, (b) baseline shape, (c) number of peaks per spectrum, and (d) mean resolving power of the identified mass peaks. Quality testing involves automated determination of individual scores for each of the four QT criteria. Each score may range between values of zero (poor quality, test failed) and 100 (excellent quality). From these scores a weighted overall QT score can be determined. All parameters for QT are adjustable through the software. The results of quality testing are visualized by a HTML document in which the spectral quality is encoded by a traffic light scheme. Furthermore, QT results can be stored in a Matlab data format which is thought to be helpful for statistical analysis of spectra quality parameters.
Noise quality test
This first QT involves the following preprocessing steps:
- Initial baseline correction by an asymmetric least-square algorithm (AsLS)
- Cutting the spectra between two m/z values, usually between m/z 2000 and 13000
- Normalization (2-norm)
- Offset correction using the high m/z region to determine the spectrum offset
Spectrum noise is then determined as the standard deviation of the pre-processed spectra, with the top 20% of the intensity data, usually the peak data, removed.
Noise values between 20 and 80 are assigned to scores of 0 and 100, respectively (default settings).
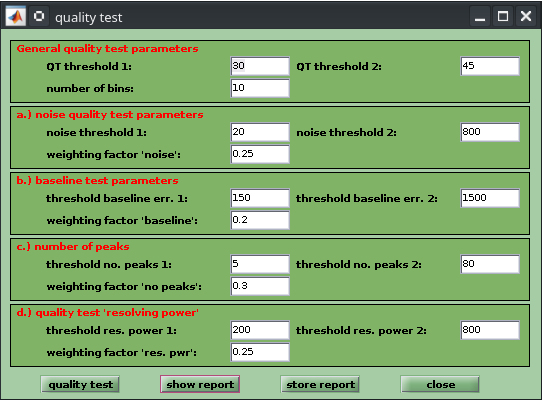 Screenshot of the spectral quality test
